Blog
Quick Tips on Using Google Chrome’s Developer Tools
Here are some quick tips on using Google Chrome’s fantastic Developer Tools. Let’s get right to it. Bring up Developer Tools with Control + Shift + i (i for inspect), or just right click (almost) anything on a page and choose Inspect element.
A Better Way to Clear the Cache
Sometimes Chrome seems to tenaciously hold onto cached files. The old way of clearing the cache and reloading was to do a Control + Shift + Delete to bring up the Clear Browsing Data window, check off the appropriate items to be cleared, hit the clear button, and finally refresh the page. This process is a bit clunky.
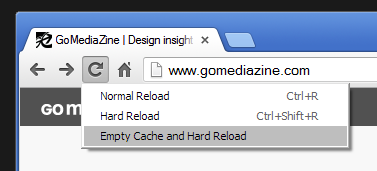
Instead, simply click and hold the refresh button. As long as you have the Developer Tools panel open for the page you’re refreshing, you’ll see a little dropdown menu that allows you to clear the cache and do a hard reload all at once. This is very handy!
Docking and Undocking the Developer Tools panel
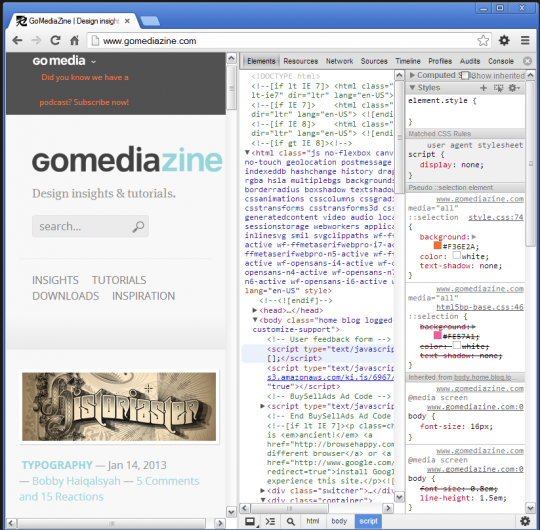
By default, Developer Tools will be docked to the bottom of the window.
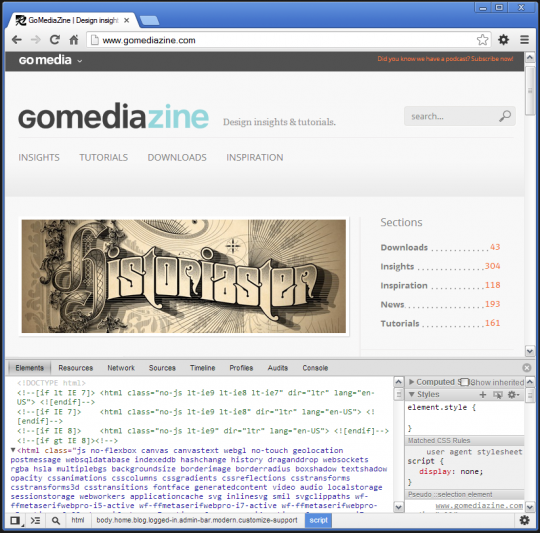
You can dock it to the right side of the window by clicking the docking icon, located in the lower left hand corner of Developer Tools.
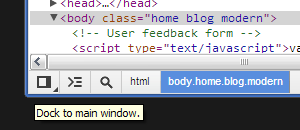
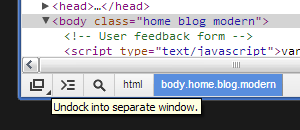
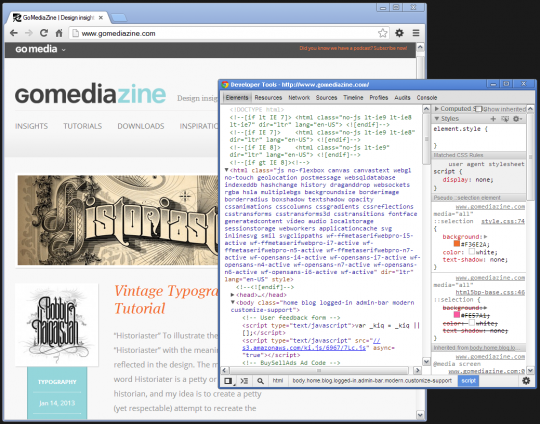
Alternatively, you can undock Developer Tools, giving it its own window entirely. Just click and hold the docking button, then choose the Undock icon. (The docking button will cleverly let you toggle between your last 2 docking preferences with a single-click, and will require the press and hold technique to access the third choice). I prefer the undocked option when I need to do a lot of window re-sizing. For instance, when working on responsive designs.
Dropdown Menu Tip
OK, time to kick it up a notch. Manipulating CSS using the Elements > Styles panels is a great way to preview CSS changes.
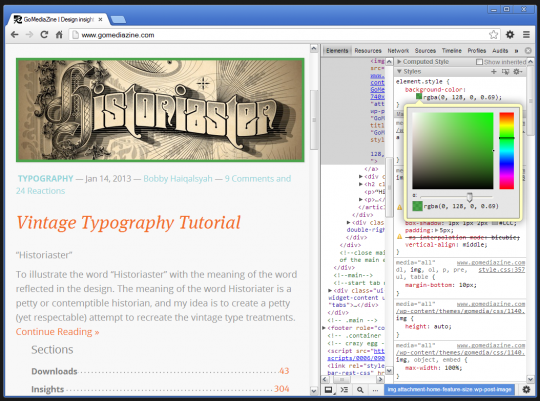
Sometimes it can be a pain to modify the CSS for elements nested within dropdown menus or other UI elements that require hovering. Sure, you can right click an item and choose Inspect element, and the element will be selected within Elements panel. That part is pretty straight-forward. However, once you move your cursor off of the element that you’re inspecting, the dropdown menu (for example) will collapse. At this point, you could manually start working your way up the HTML tags within the Elements panel and use the Toggle Element State icon to apply the hover state to your menu item’s parent, but this is tedious.
Here’s a better approach:
- Hover over the item that you want to inspect, and choose Inspect element. This will highlight the targeted element within the Elementspanel.

- Now for the real magic. Hover over the item again. This time, right click it. Don’t choose anything on the context menu that appears. Instead, move your mouse over to the Developer Tools window/panel. Now the dropdown menu will remain opened and the targeted element will be selected within the Elementspanel. It’s now much easier to change the styles of the targeted item as well as its siblings while keeping them all in view.

Right Click > Inspect Element > Right click desired item, then move mouse over to Developer Tools without selecting anything in the context menu.
Console Quick Tips
1.) When you’re on the any of the panels within Developer Tools, you can use the Esc key to quickly toggle the JavaScript console.
2.) With the console focused, you can clear its contents with Control + L. This is handy when you have youtube or vimeo videos embedded on a page via iframes, as they tend to add noise to the console.
3). The console is handy for seeing any errors that a script may be generating, but there’s way more to it than that. For example, it can also be used to run JavaScript snippets.
Example: Show an alert box.
alert('This is neat!');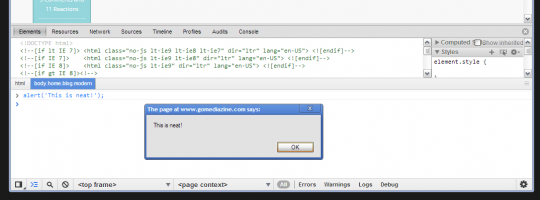
If the page is using a JavaScript library such as jQuery, you can use that in the console as well. Give it a shot!
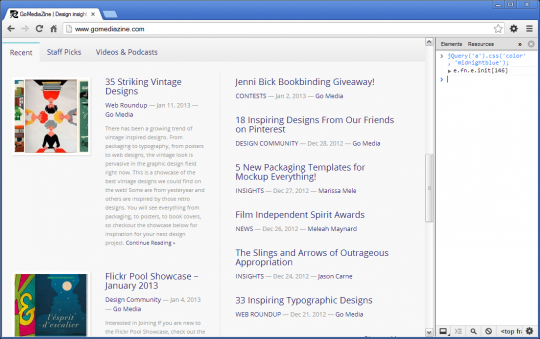
Example: Using jQuery, change the color of all links to MidnightBlue.
jQuery('a').css('color', 'midnightblue');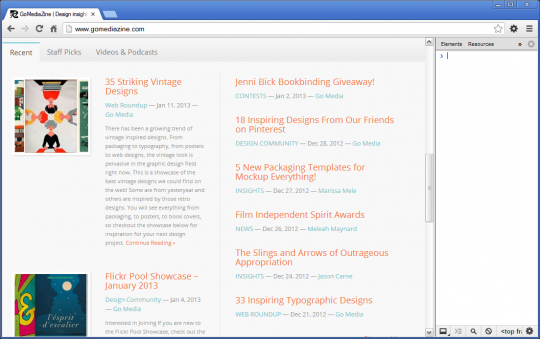
Move Elements Within the Page
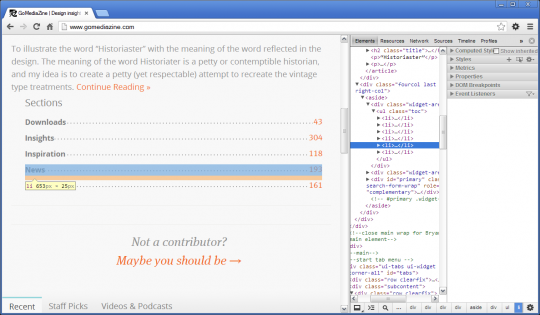
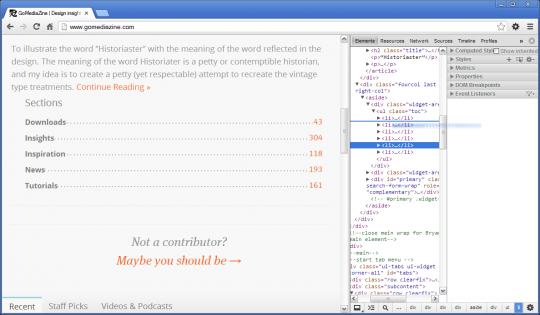
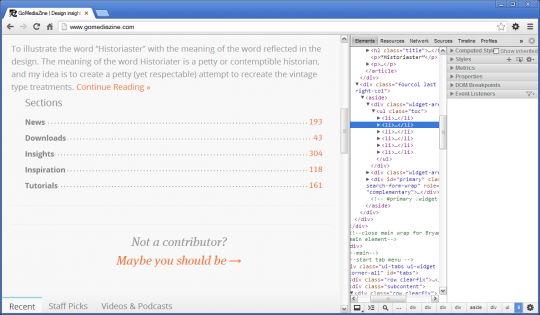
You can easily move elements around on the page by clicking and dragging them within the Elements panel. This can be handy when experimenting with the order of elements within lists and menus or for moving entire sections of a page around.
Wrapping up
I hope you were able to find something useful here. For a more general overview of Developer Tools, take a look at the official documentation. Feel free to share any quick tips of your own in the comments. Cheers, and thanks for reading!